DAVID Documentation: Functionally Related Genes
Any given gene is associating with a set of annotation terms. If genes share similar set of those terms, they are most likely involved in similar biological mechanisms. The algorithm adopts kappa statistics to quantitatively measure the degree of the agreement how genes share the similar annotation terms.
-
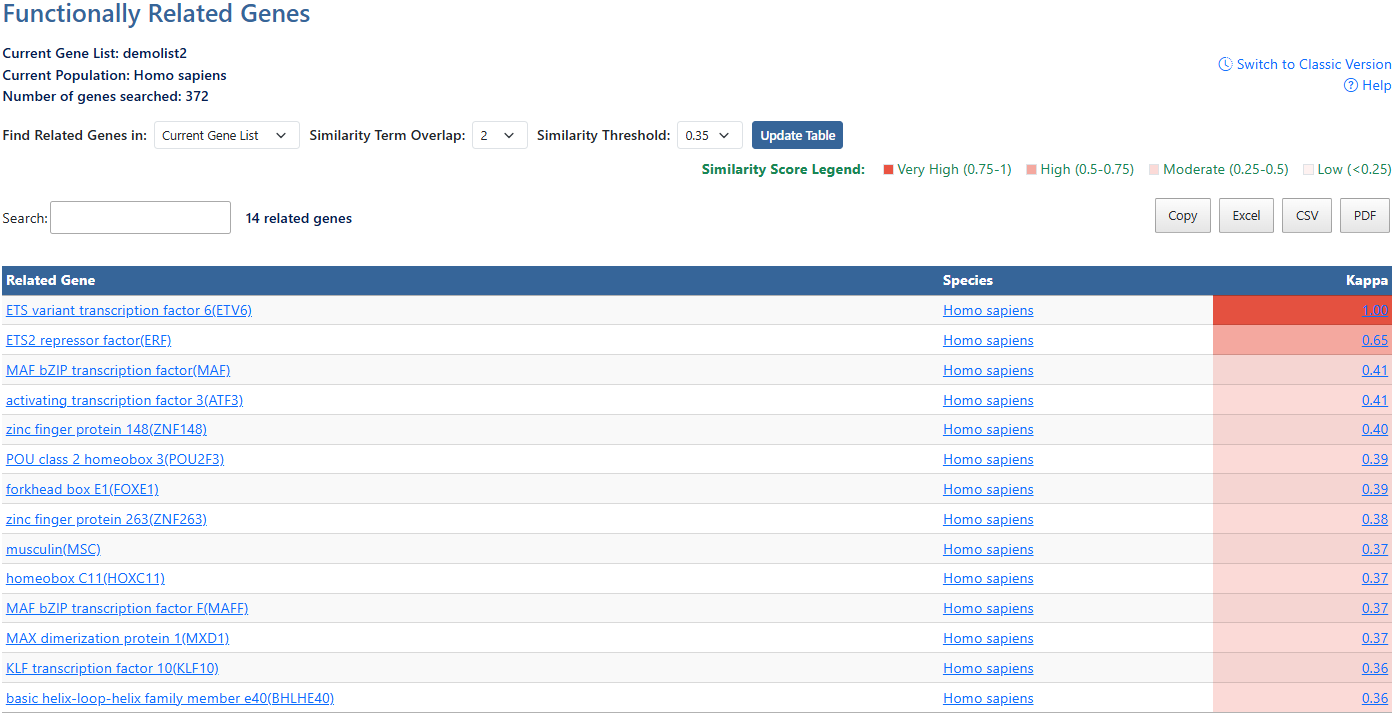
Gene ListCurrent gene list selected for view and background species being analyzed. Also show number of genes searched.
-
Help and Switch to Classic VersionLink to this help page and provides access to the legacy Gene List Report interface.
-
Current Gene List or Current PopulationClick to access a drop-down menu to select viewing current gene list or the current population (species)
-
Similarity Term OverlapClick to access a drop-down menu of overlap values. The minimum number of annotation terms overlapped between two genes in order to be qualified for kappa calculation. This parameter is to maintain necessary statistical power to make the kappa value more meaningful. The higher the value, the more meaningful the result is.
-
Similarity ThresholdClick to access a drop-down menu of theshrold values. The minimum kappa value to be considered significant. A higher setting will lead to more genes going unclustered, which leads to a higher quality functional classification result with fewer groups and fewer gene members. Kappa value of 0.3 starts giving meaningful biology based on our genome-wide distribution study. Anything below 0.3 has a good chance to be noise.
-
Update TableAfter making adjustments to filtering options, click this button to update the table using the selected parameters.
-
Similarity Score LegendGeneral guide to understand the similarity scale of Kappa scores.
-
Search and related genesThe search box filters all table results in real time and the number of resulting genes is displayed.
-
Export OptionsResults can be exported using Copy, Excel, CSV, or PDF. Exports reflect the current filtered and sorted view.
-
Related GenesList of related gene results. Click the column header to sort by this value. Click on gene name links to be directed to DAVID gene report for that gene. For more information, see the Gene Report documentation page.
-
SpeciesClick the column header to sort by this value. Click the Species name link to go to NCBI taxonomy entry.
-
KappaMeasurement of agreement between two sets of categorized data. The higher the value of Kappa, the stronger the agreement. Click to sort by this value. Click the value link to be directed to the Related Evidence page for this gene. For more information, see the Related Evidence documentation page.